Algorithms and software for modeling, optimization, and data Science
- Large-scale nonlinear programming
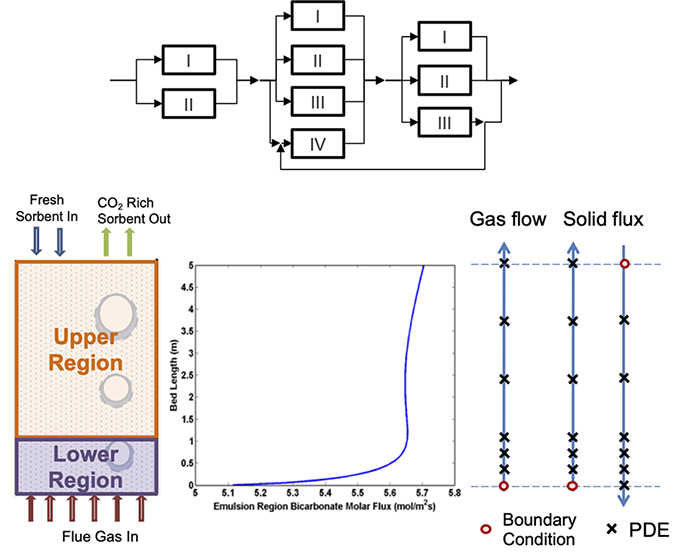
- Optimization of DAE and PDAE systems
- Mixed-integer programming, generalized disjunctive programming
- Global optimization and mixed-integer nonlinear programming
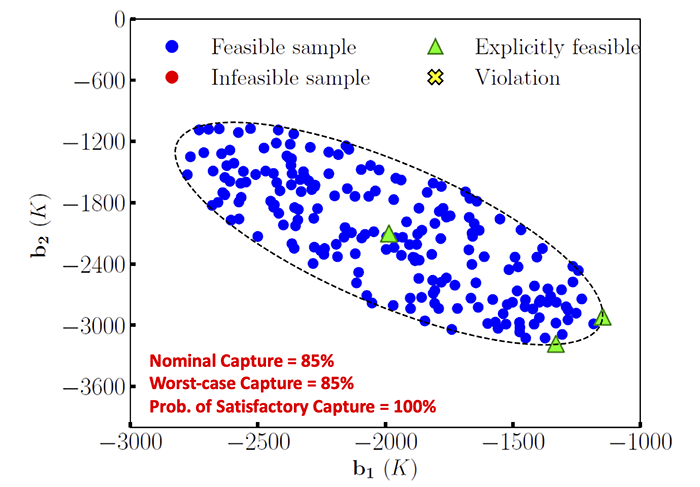
- Optimization under uncertainty (stochastic and robust)
- Data analytics and integration of machine learning and optimization
- High-performance scientific computing
Process synthesis, design, operations, and control
- Automatic synthesis of integrated process flowsheets
- Conceptual design using superstructure optimization
- Process modeling and optimization
- Optimization of operations and model-based control
- Parameter estimation and process control
- Design and operation of energy systems
- Sustainable processes and circular economies
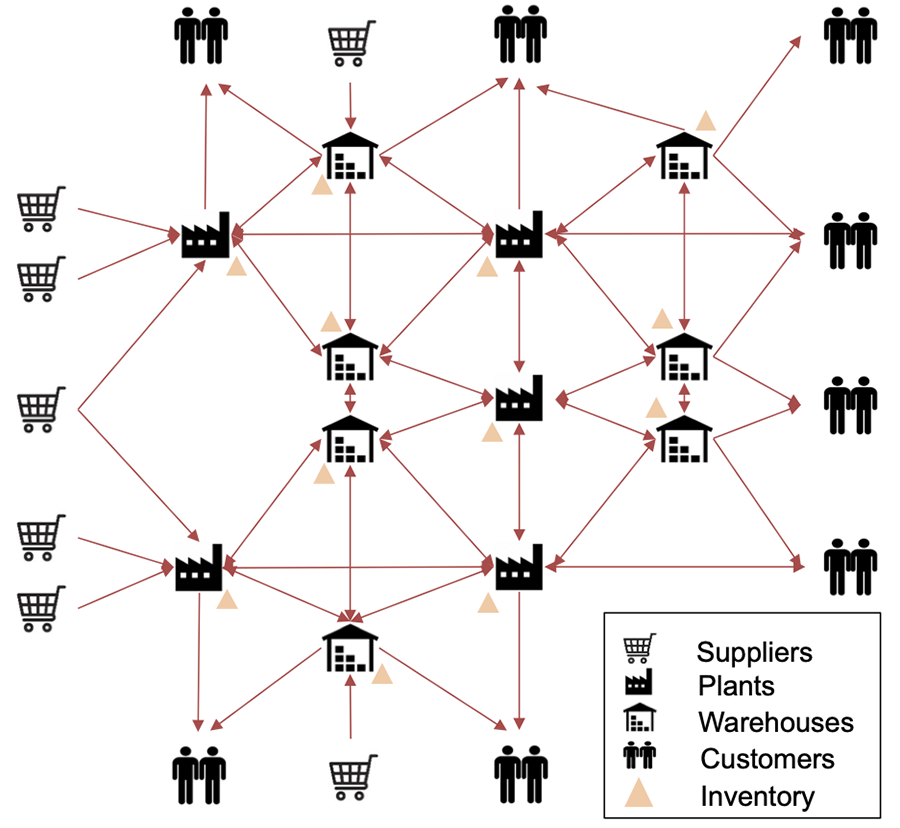
Enterprise-wide optimization
- Scheduling and planning of batch and continuous process systems
- Distribution, logistics, and supply chain optimization
- Resilient design and operation of critical infrastructure
- Pharmaceutical manufacturing and R&D pipeline optimization
- Expansion planning (e.g., grid and other critical infrastructures)
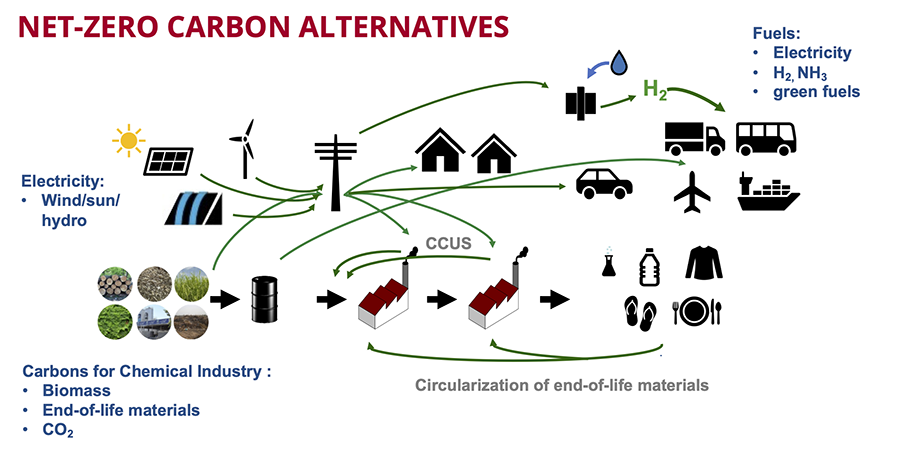
Sustainability and circular economies
- Net-zero carbon initiatives
- Design and optimization of sustainable systems
- Optimization of advanced energy systems with IDAES
- Decarbonization and hybrid energy systems
Product and materials design
- Design of environmentally friendly molecules and mixtures
- Materials and molecular design
- Optimal product, process, and platform design
- Bioinformatics and structural biology
- Analysis and design of metabolic networks
Research groups